Dissertation Name
Space Vector: Video Games for Introductory Newtonian Mechanics
Committee
Dr. James Paul Gee (chair)
Dr. Robert Atkinson
Dr. Brian Nelson
Dr. Scott Stevens (Carnegie Mellon University)
Introduction
For my dissertation, Space Vector: Video Games for Introductory Newtonian Mechanics, I created two casual games (1980s-style arcade games) to introduce Newtonian mechanics concepts. Although video games for learning have been around for a long time, there are still relatively few examples of educational video games that have been created specifically for an academic subject that have been properly evaluated. [1] (Numbers in brackets refer to sections under References below.) Researching the creation of educational video games and educational software is important because software can make good pedagogy accessible to everyone, invite learners into a new subject in an appealing way, analyze learner actions very precisely, and even do some things that are impossible in the real world. For example, students can’t experience what it’s like to be in a spaceship, but this can be simulated in a game. We can also use software to simulate things that are physically impossible or incorrect as a way to manifest learners’ (incorrect) ideas. Software can make thought visible.
My work focused on conceptual understanding rather than solving math problems. There’s abundant evidence that students can successfully solve physics problems without having a Newtonian conceptual understanding of the phenomenon being addressed. [2] They will use pre-Newtonian justifications for their answers. Once they encounter a problem that isn’t familiar, their problem solving ability breaks down. Although I worked alone on my games—not ideal since games are so time intensive and require multidisciplinary knowledge—, I managed to get results comparable to other projects as measured by a subset of Force Concept Inventory questions. The Force Concept Inventory is an extensively used assessment tool for introductory Newtonian mechanics conceptual understanding that measures knowledge of force and identifies specific misconceptions that students have.
Dissertation Abstract
This dissertation describes Space Vector 1 and Space Vector 2, two video games that introduce Newtonian mechanics concepts. Space Vector 1 is a side-scrolling game, in which players choose to drop bombs or supplies. Players had to identify if the physics was correct during a mission, or they had to plot the trajectory of a falling object, which was then simulated. In Space Vector 2, players were given velocity and acceleration values and had to plot the trajectory of a spaceship across a grid, or players were given a trajectory of a spaceship on a grid and had to program the velocity and acceleration values to produce the trajectory. Space Vector 1 was evaluated with 65 college undergraduates. Space Vector 2 was evaluated with 18 high school students. All participants were given a subset of the Force Concept Inventory, a standard assessment tool in physics education, as a pretest and posttest. Space Vector 1 was evaluated with a single group pretest-posttest design. Space Vector 2 was evaluated with a 2 x 2 ANOVA, where the factors were game mechanic (prediction mechanic or programming mechanic) and bonus questions (bonus question after a mission or no bonus question). Bayesian statistical methods were used for the data analysis. The best estimate for the average change in test scores for Space Vector 1 was a score gain of 1.042 (95% Highest Density Interval (HDI) [0.613, 1.487]) with an effect size of 0.611 (95% HDI [0.327, 0.937]). The best estimate for the grand mean of change scores in Space Vector 2 was an increase of 0.78 (95% HDI [-0.3, 1.85]) with an effect size of 0.379 (95% HDI [-0.112, 0.905]). The prediction/no bonus question version produced the largest change in score, where the best estimate for the mean change score was an increase of 1.2. The estimation intervals for the Space Vector 2 results were wide, and all included zero as a credible value.
Description of Space Vector 1 (Excerpt from Chapter 1)
In Space Vector 1, the player must drop cargo from a spaceship on targets while flying over the landscapes of alien planets. At the beginning of the game, players choose whether the cargo will be bombs or supplies for every mission. There are two types of missions. In the first type, the player controls the spaceship and drops cargo as needed. During the flight, the motion of the cargo may be incorrect as it falls. After the mission, the player is asked whether the physics was correct or whether something was incorrect. If the player answers correctly, the player receives bonus points. In the second type of mission, the player is given an initial horizontal velocity and a gravitational constant. The player must predict the path of a cargo on a grid after it is released by the spaceship for a duration of three seconds. After the prediction is made, the player becomes a copilot who protects the ship while the game engine releases the cargo at the appropriate times. A cargo will fall short or long of a target if the predictions are incorrect. After some tutorial missions in which the player learns to fly the spaceship and avoid threatening obstacles such as missiles, uniform motion and acceleration are systematically introduced to the player. The player wins the game once the player achieves 55,000 points and completes all required missions.
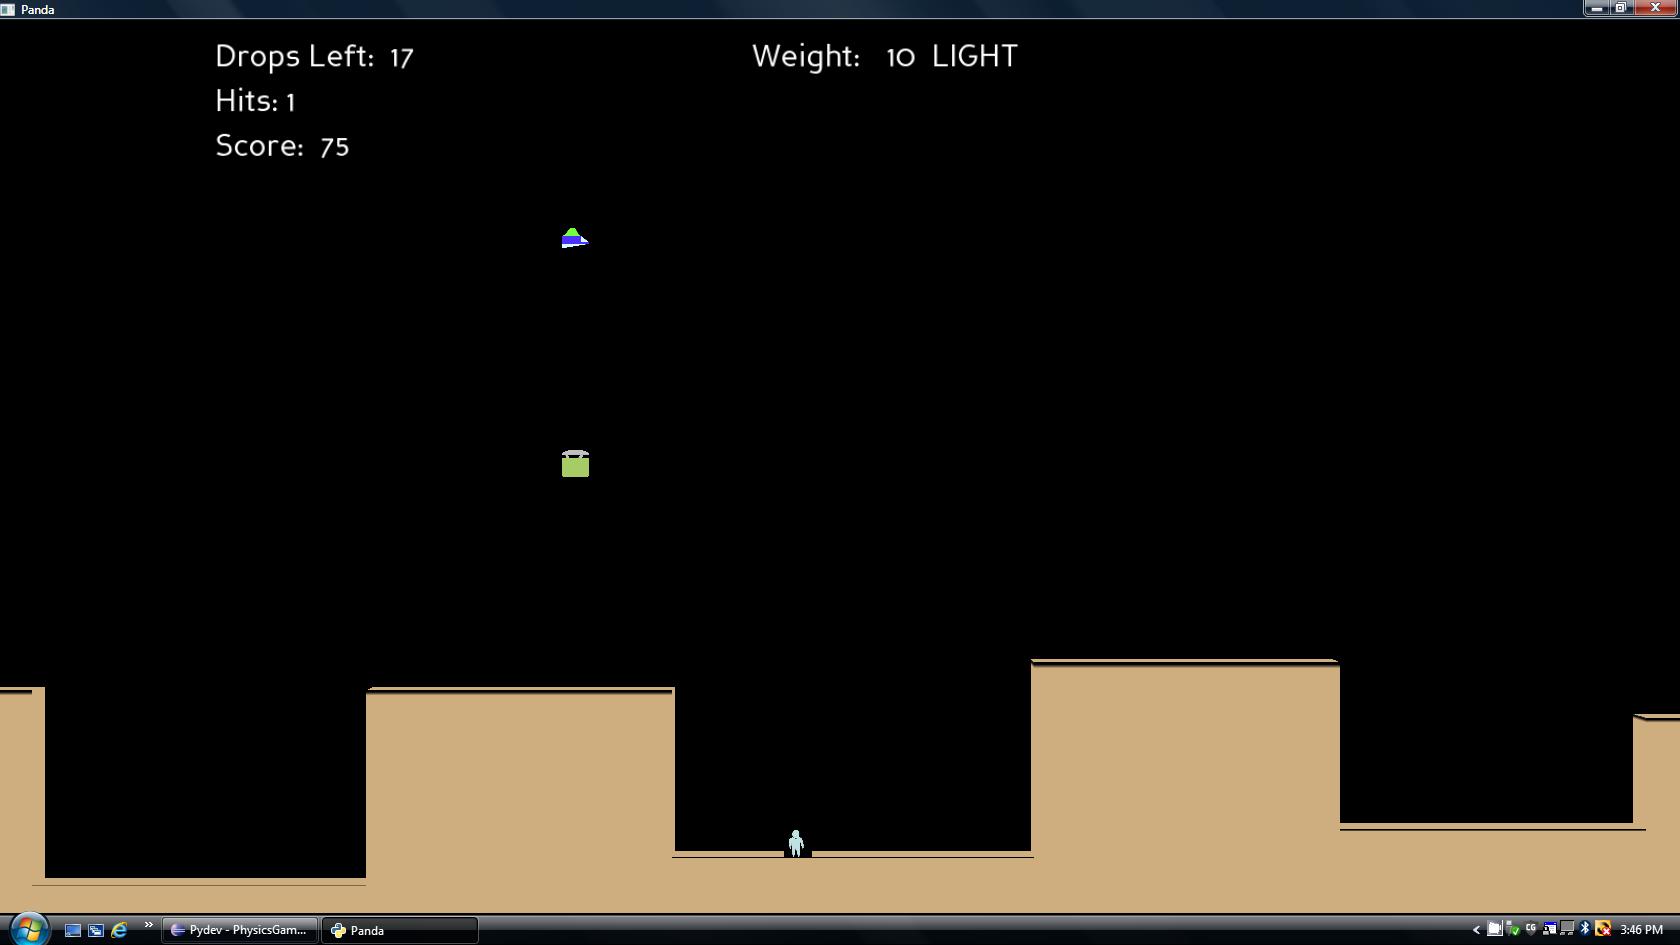
Tutorial mission where the player is dropping a supply.
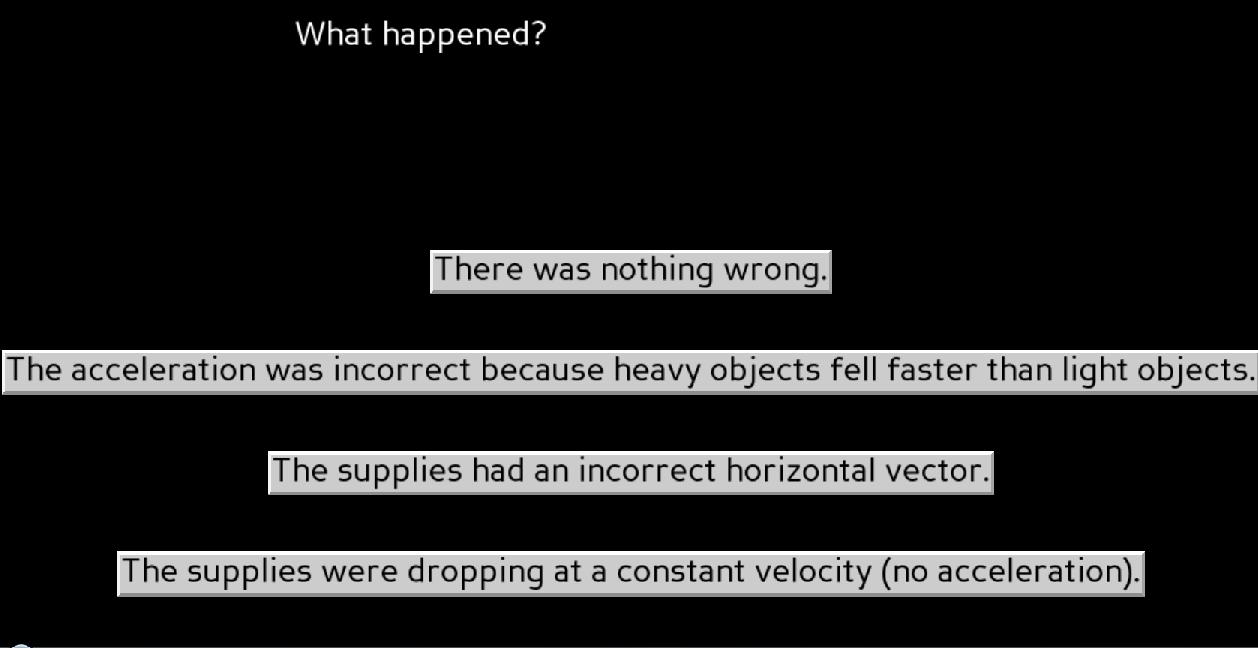
The player answers whether a mission had incorrect physics.
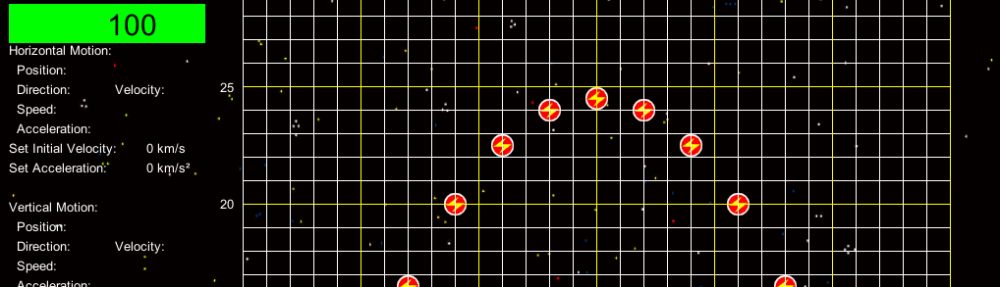
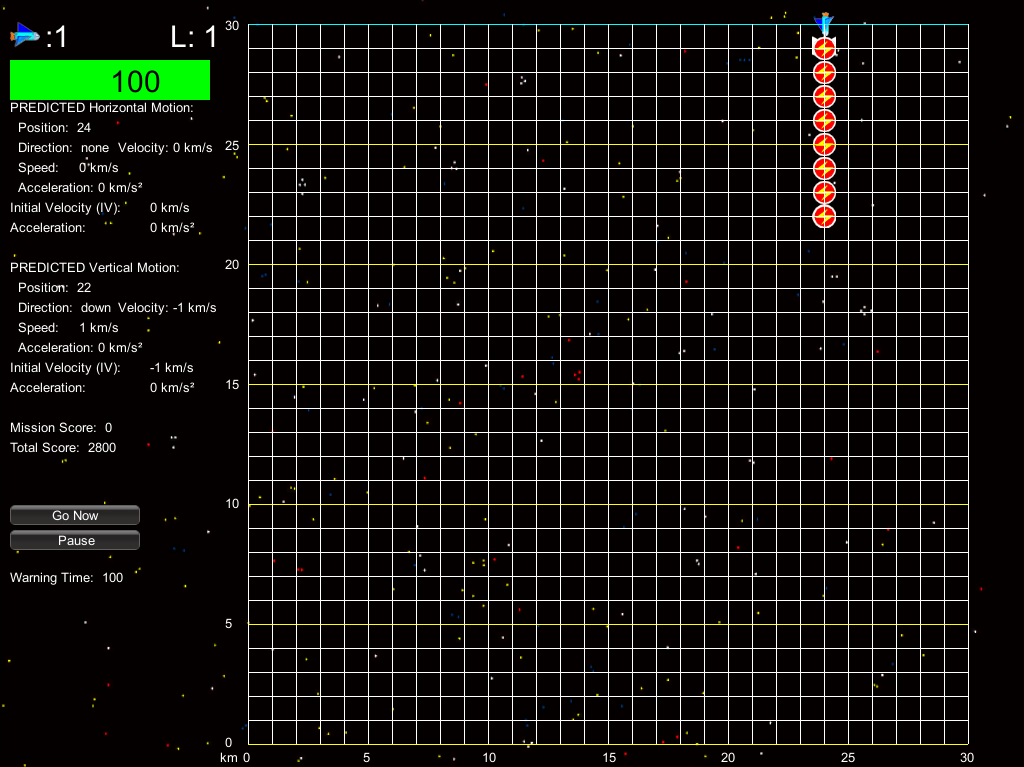
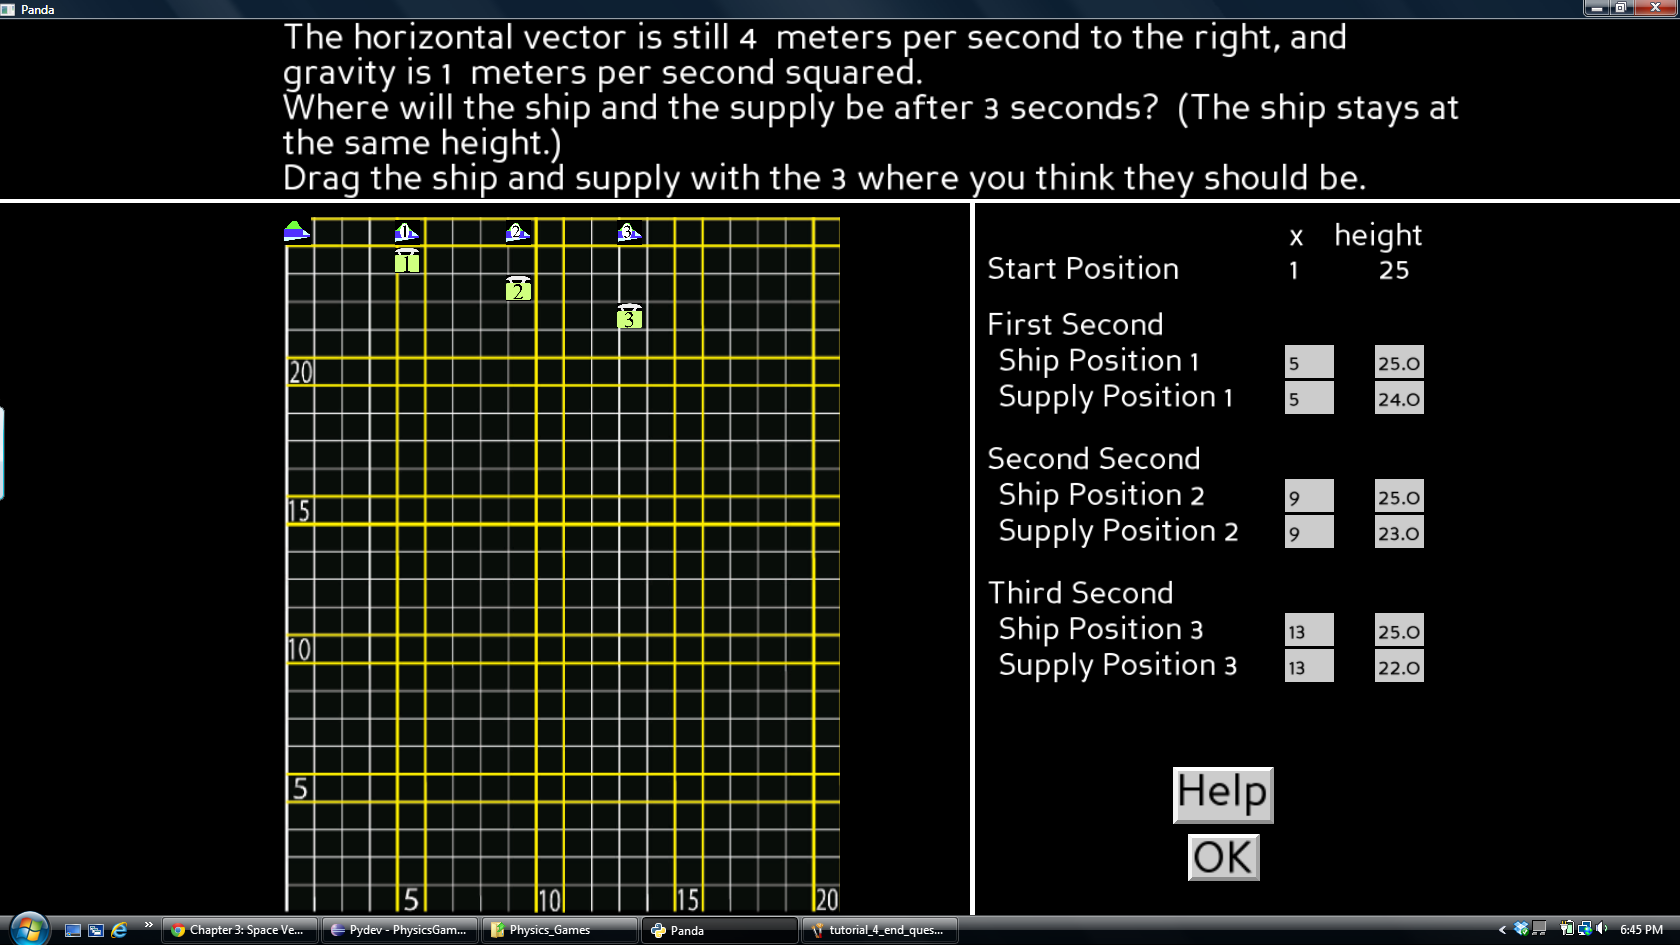 The prediction grid screen where the player plots cargo (bomb or supply) motion.
Description of Space Vector 2 (Excerpt from Chapter 1)
In Space Vector 2, the player has to help spaceships cross a portion of space that is demarcated by a grid. The spaceship needs an energy packet every second to survive, or it loses health and may suffer a system crash. Extra energy packets also decrease spaceship health due to oversupplying the spaceship’s energy system. Asteroids and missiles cross the grid and threaten the destruction of the energy packets and spaceship. Players can destroy the asteroids and missiles and recreate the energy packets when they are destroyed. When four spaceships successfully cross the grid, players advance to a new level, where a new physics concept is introduced. The concepts for the levels are respectively: uniform motion in one dimension, uniform motion in two directions, acceleration in one dimension, projectile motion starting above ground (half a parabolic arc), projectile motion starting on the ground (full parabolic arc), parabolic motion in space (acceleration in one dimension, uniform motion in the other dimension), and acceleration in two dimensions. The player wins when all levels are complete and the player has 75,000 points. If the player completes all the levels without 75,000 points, the game engine randomly selects a mission from the last three levels until the player wins 75,000 points.
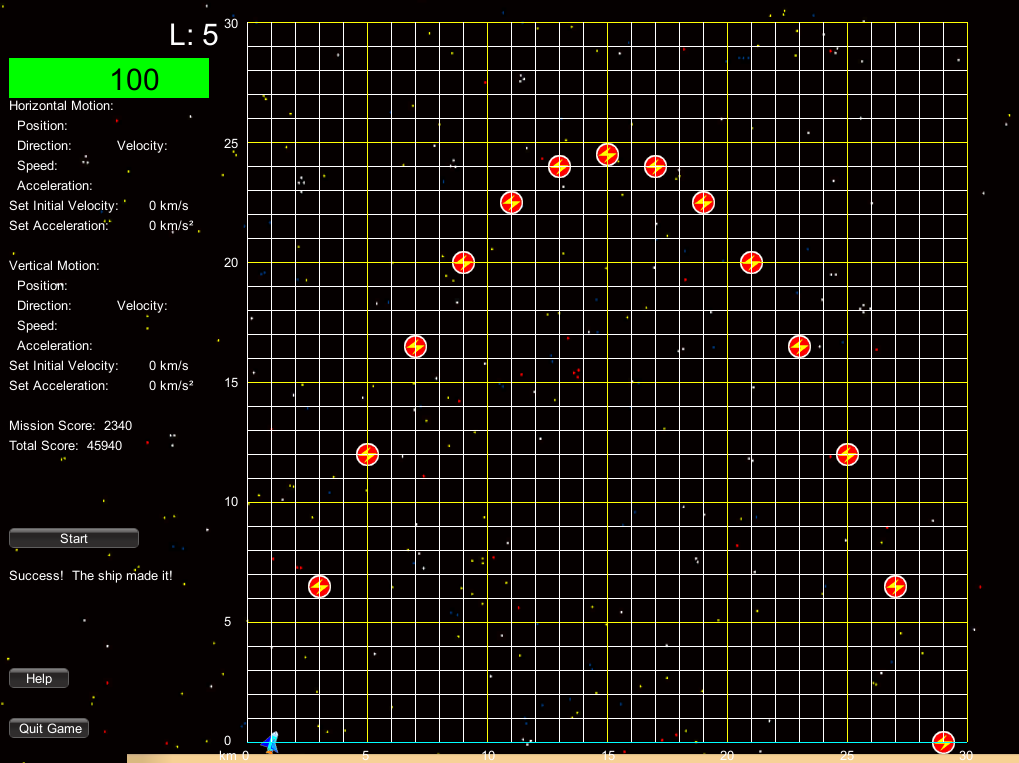
There are two game mechanics in Space Vector 2. The first mechanic is the prediction mechanic. In this mechanic, the player is given the initial position of the spaceship, the initial velocities in the horizontal and vertical dimensions, and accelerations for both directions. The grid is blank, and the player must place energy packets on the grid in the correct locations before a timer runs down and the spaceship begins its flight. The second mechanic is the programming mechanic. In this mechanic, the player is given the initial position of the spaceship on the grid with the energy packets correctly placed. The player must program the settings for the spaceship by pressing buttons to set the initial velocities and accelerations before a timer runs out and the ship begins its flight. The game engine is designed so that players can be assigned to one mechanic or the other.
Space Vector 2 was created in response to the evaluation of Space Vector 1. Graphing was a major component of the game experience, yet there was no or little increase on question items on the Force Concept Inventory regarding the interpretation of plots of motion and trajectories although there was a large increase in correct responses with a group of questions about freefall. There were also weaknesses in the interface design that hindered players’ learning.
Example of a prediction mission where the player must place energy packets on the grid for the spaceship to pick up every second.
A programming mission where the trajectory is given and the player must program the correct velocity and acceleration values.
A projectile motion mission.
A text bonus question.
A visual bonus question.
Summary of Results
For the data analysis, I used Bayesian statistical methods. This is still novel in educational research. Frequentist statistics, the statistics that we normally learn in introductory courses (frequentist statistics that focuses on null hypothesis significance testing), has some real limitations. First, p-values are not very predictive of future replication results. Researchers who use these techniques should report confidence intervals and an effect size. Ideally, research should be replicated. Second, statistical significance does not mean much. It is common to see “significance” used to imply importance in research literature, when statistical significance has a very specific technical meaning. Third, it is very common for people to misinterpret—and just flat out not know—what a p-value is or how to interpret traditional statistics. There is a growing body of research describing misconceptions in statistics. To be clear, frequentist statistics is not wrong. It is limited, and it is imperative to understand the limitations. [3]
So why Bayesian techniques? The main reason is that Bayesian statistics tells us things that we really want to know. Bayesian statistics allows us to say things like: Given the data and our assumptions about the data, there is a 95% chance that the mean (average) is within the interval bounded by values X and Y. Not only that, the distribution of the values with interval X and Y tells us which values are more plausible. Bayesian statistics also has some real advantages: it is possible to create complicated models, no adjustments are needed for unbalanced designs, no adjustments are needed for comparisons, the intentions of the experimenter do not affect the probability space, etc. In short, Bayesian statistics provides meaningful results that are more intuitive to interpret. [4]
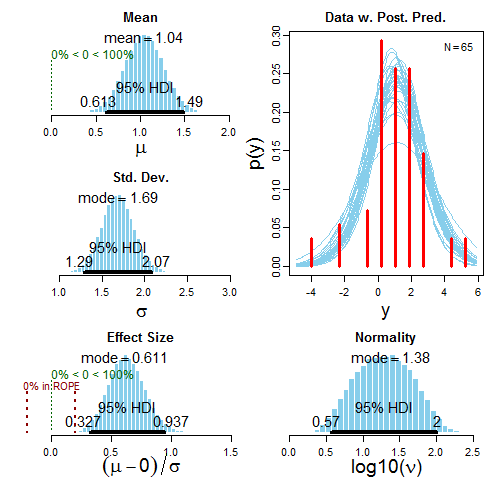
The Space Vector 1 evaluation was a single group pretest-posttest study with 65 undergraduate students. A subset of 15 questions from the Force Concept Inventory was used for the test. The figure above summarizes the results. Bayesian data analysis is about estimation over intervals of values rather than single points. The shapes of distributions are what is informative. These distributions tell us that there is a 95% chance that the mean is between .61 and 1.49 inclusive given the data (and the assumptions about the data). HDI stands for highest density interval and can go by different names such Bayesian confidence interval. The best estimate for the mean increase in scores is approximately 1.04. Keep in mind that this is a probabilistic model, and, if we run the software again, the values will most likely not be the same. They should be pretty close, though. There is a 95% chance that the effect size is between .33 and .94, where the best estimate is approximately .61. Traditionally, this is considered between a medium and large effect size. There aren’t a lot of studies to compare the effect size, so it would be a good baseline for future studies. The ROPE stands for Region of Practical Equivalence. This can be used to make specific judgments about the effect size if needed. For example, if you believe that an effect size betweeon -.2 to .2 (traditionally a small effect size) is equivalent to 0, you can see how much of the distribution is within the ROPE. In this case, none of the final distribution falls within the ROPE. The software package I used was Kruschke’s BEST software [4], which uses t distributions to model the data. The normality is a measure of how close the data is to a normal distribution, which is 1.5 or greater. The data is not quite normal, but that isn’t a problem. If the values were closer to zero, it would call the model into question as the t distributions wouldn’t capture the shape of the data well. I’m skimming over many details here, but this should give you a sense of what a Bayesian analysis tells you. See the references under [4] for more details.
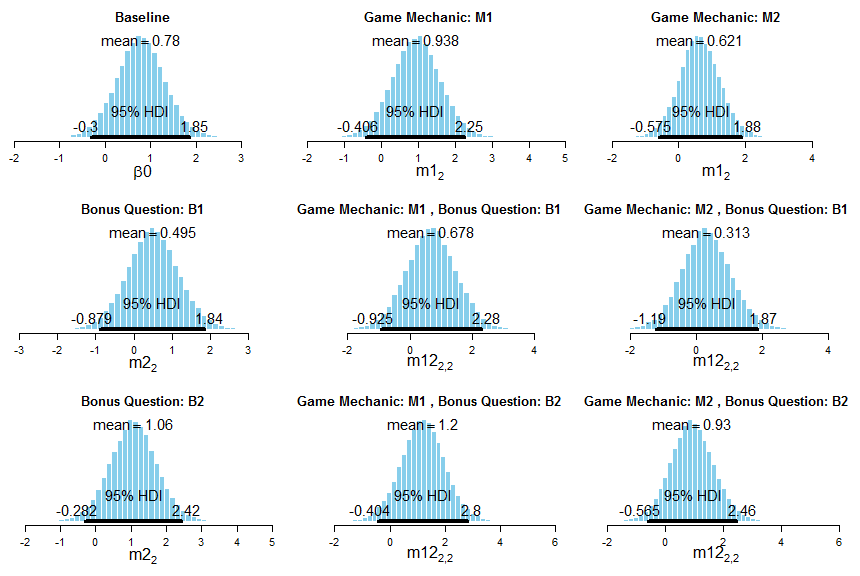
The evaluation for Space Vector 2 was different. There were two variables: game mechanic and presence of bonus questions. Players were assigned to one game mechanic and whether they would have a bonus question. The game mechanics were the prediction mechanic and the programming mechanic as described above. Therefore, there were four possible groups that a learner could be assigned to, and the study was an ANOVA 2 x 2 study. A subset of 18 questions from the Force Concept Inventory was used—the same questions as in the Space Vector 1 study with three more questions. This figure shows the distributions for the means. The upper left corner is the baseline (grand mean). Game mechanic M1 is the prediction mechanic; M2 the programming mechanic. Bonus Question B1 is bonus questions; B2 is no bonus questions. The game was tested with 18 high school students. Nine students played each mechanic as well as each bonus question condition, so there were four or five students in each group. For the overall mean (the baseline or grand mean), there is a 95% chance that the mean is between -.3 and 1.85, where the best estimate is approximately 0.78. We would expect that players scores would increase by 0.78 on the test on average. Since the groups are small, the interval of likely scores (the highest density interval) is wide. The surprising thing is what is happening in the prediction-no bonus question group, which, given the data, has the highest average increase in test score, approximately an increase of 1.2. I would expect players of the prediction mechanic to do better because it is harder: the player must articulate a model of motion through placing the energy packets. It is surprising that no bonus questions is leading because one would think that bonus questions would reinforce concepts and, thereby, improve scores on the assessment. During my defense, one of my committee members, Brian Nelson, said that he was seeing a similar phenomenon in some of his work. Perhaps having questions outside the main action of the game is more distraction than help. Any results here should be taken with caution since it is a small study, but it is intriguing.
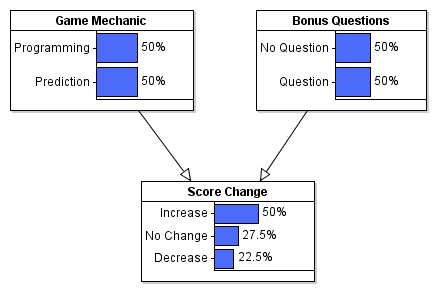
A reasonable question to ask is: What is the chance that playing a specific version of Space Vector 2 will increase the player’s test score? The above figure shows a simple Bayesian net that calculates this given the data collected. [5] What this figure is saying is that, if a player is randomly assigned to any of the four versions of the game, there is a 50% chance that the player’s score will increase, a 27.5% chance of no change, and a 22.5% chance of a score decrease. Here is what happens if the player is assigned to the prediction-no bonus question version:
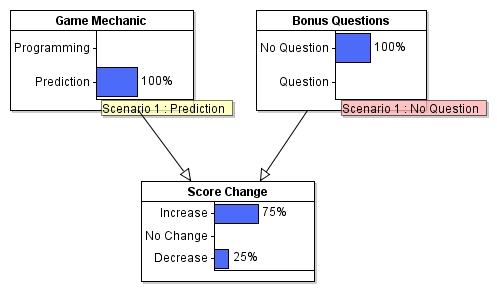
There is a 75% chance that the player’s score will increase.
Recommendations
Space Vector 1 and Space Vector 2 are very much prototypes, and there is still much to learn. It would behoove anyone who wants to try to do this type of work to study modeling instruction. Pedagogy counts! Don’t reinvent—or even invent—this wheel if you don’t have to! I could barely scratch the surface of what modeling instruction implies for designing games like this. Specifically, if you want to build successful physics games—or other games for natural science—, focus on individual models. Designers are tempted to do too much, especially when the game isn’t integrated into a larger curriculum where there’s guidance by an expert instructor. Students have limits, and they have to articulate the models (concepts) in a variety of ways. If you can teach a single model in two hours through a software experience, you’ve really accomplished something. There are blogs by teachers that do an excellent job of explaining how this pedagogy works. Also, I hope that researchers and teachers continue to develop modeling instruction and extend it into new areas. Designers of educational experiences, whether making games or not, would be well served deepening their knowledge in this area. It is not a framework for all types of learning, but it can imply constraints that must be identified early in the design process that could be necessary conditions for a successful outcome. Identifying these constraints will increase the chance of creating a successful learning experience.
References
The references provided here are far from exhaustive. I’m just providing enough information to get you started.
[1] Examples of comparable projects:
Newton’s Playground by Valerie Shute and colleagues
SURGE by Doug Clark and colleagues
Mecanika by François Boucher-Genesse
[2] One of the challenges of teaching physics is that students come with incorrect, preconceived notions of how objects move, which are difficult to overcome. Such misconceptions about force and motion are found throughout Western history as can be seen in Aristotle and medieval philosophy, especially in Jean Buridan’s impetus theory. A good place to start about students’ beliefs about motion and force prior to instruction is Common Sense Concepts about Motion by Halloun and Hestenes. An alternative view to misconceptions is phenomenological primitives (p-prims) proposed by Andrea diSessa, which is the idea that students have ideas that are not fully formed and are used in haphazard ways. diSessa’s book, Changing Minds, discusses this idea as well as his work with educational software. One of the best pedagogical methods for teaching physics is modeling instruction. The American Modeling Teachers Association has extensive resources for natural science education.
[3] A good place to start learning about the limitations of null hypothesis significance testing is Gerd Gigerenzer’s The Null Hypothesis. Understanding the New Statistics by Geoff Cumming describes the problems with null hypothesis significance testing and makes recommendations for better statistical reporting staying within a frequentist framework and the guidelines of the American Psychological Association.
[4] An accessible introduction to Bayesian data analysis with free, online software is John Kruschke’s Doing Bayesian Data Analysis. I used Kruschke’s software in my work, especially his Bayesian substitution for the t test. Kruschke thoroughly documents the advantages of Bayesian methods in his writings.
[5] An accessible introduction to Bayesian nets with accompanying software is Risk Management and Decision Analysis with Bayesian Networks by Fenton and Neil.